
Machine Learning for Structural Phase Mapping
Lippmaa Group
Structural phase analysis in thin film materials development is usually done by ex-situ x-ray diffraction (XRD) after the film growth is finished. The XRD analysis typically takes longer than the film synthesis and the XRD analysis provides an average composition of the whole film volume without being able to distinguish which phases that occur at the surface or at the substrate interface. An alternative structure analysis method is in-situ reflection high-energy electron diffraction (RHEED), which provides structural information on the surface of the film in real time during growth. While this makes RHEED an attractive alternative to XRD, manual analysis of RHEED patterns to determine the phase composition is generally time-consuming and thus rarely used for contemporaneous structure analysis with film growth.
We have developed a machine learning workflow to automatically detect and locate various diffraction features in complex diffraction patterns. We use the U-Net neural network segmentation algorithm to quickly determine where diffraction spots and streaks occur in a diffraction pattern, as illustrated in Fig. 1. The neural network has to be trained before such image segmentation is possible. For this purpose, we collect a large number of visually different diffraction patterns and hand-label those training patterns, manually marking the position of each diffraction spot and streak. The training image set is then used to train the U-Net to recognize the desired features in typical RHEED patterns. As shown in Fig. 1, U-Net can reliably distinguish between overlapping spots and streaks and can find even very weak features that are difficult to detect by eye.
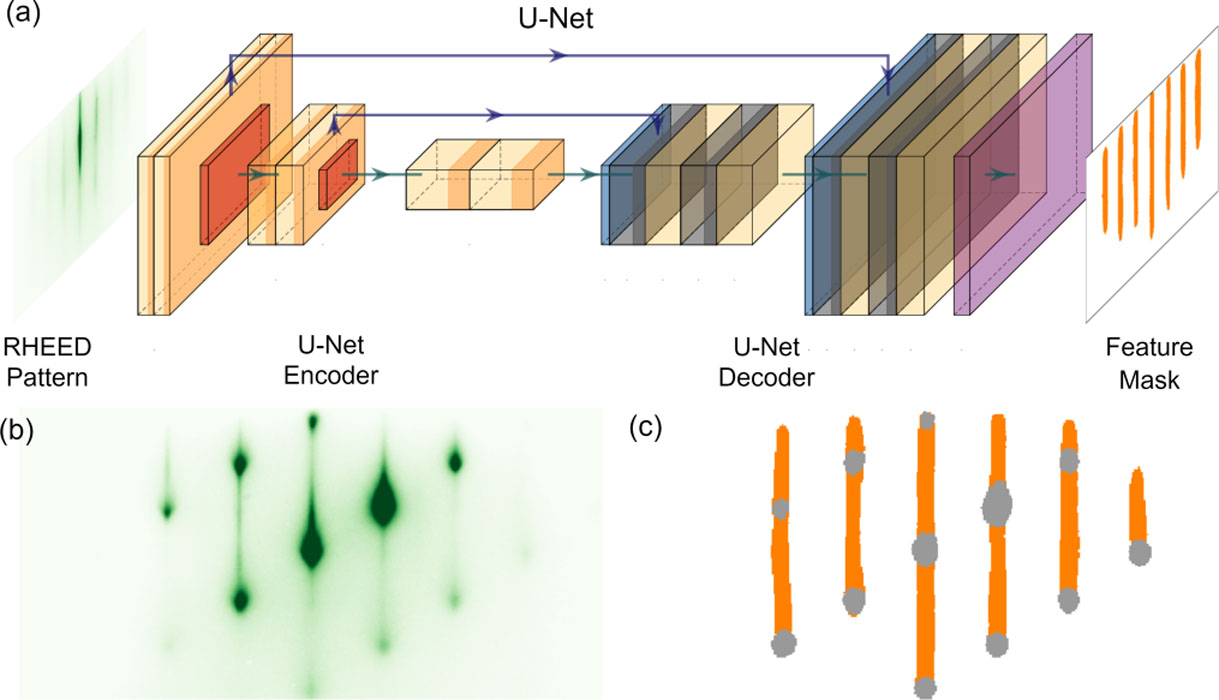
Fig. 1. (a) Schematic diagram of the U-Net model used for semantic segmentation of RHEED patterns. (b) and example pattern of a hematite film. (c) Masks for diffraction spots (gray) and streaks (orange) generated by the neural network model.
The U-Net segmentation tool produces mask patterns. As the next step in the workflow, the original image intensity distribution is examined in each mask area. For example, it is possible to integrate the intensity in the vertical direction in each mask area and examine the resulting cross-section plots by peak fitting to determine accurate horizontal diffraction feature positions. The feature spacing corresponds to the distance between neighboring reciprocal space points and can thus be used to calculate the in-plane lattice parameter. In case the surface contains a mixture of phases, multiple spot or streak periodicities will appear on the surface. An iterative approach was developed to extract all base periodicities from a complex image, providing a list of periodicities. The total diffraction intensity corresponding to each bas distance is then used to calculate the phase composition ratios.
A series of thin film FeOx samples was synthesized over a broad range of film growth temperatures and ambient oxygen pressures. The RHEED patterns of all films were analyzed using the automated composition analysis workflow. This produced for each synthesis phase space point a descriptor containing information on the phase lattice parameters and the associated relative diffraction intensities. Clustering was then used to form a phase map as shown in Fig. 2, where a pie diagram at each synthesis point represents the relative intensities of each clustered lattice parameter.
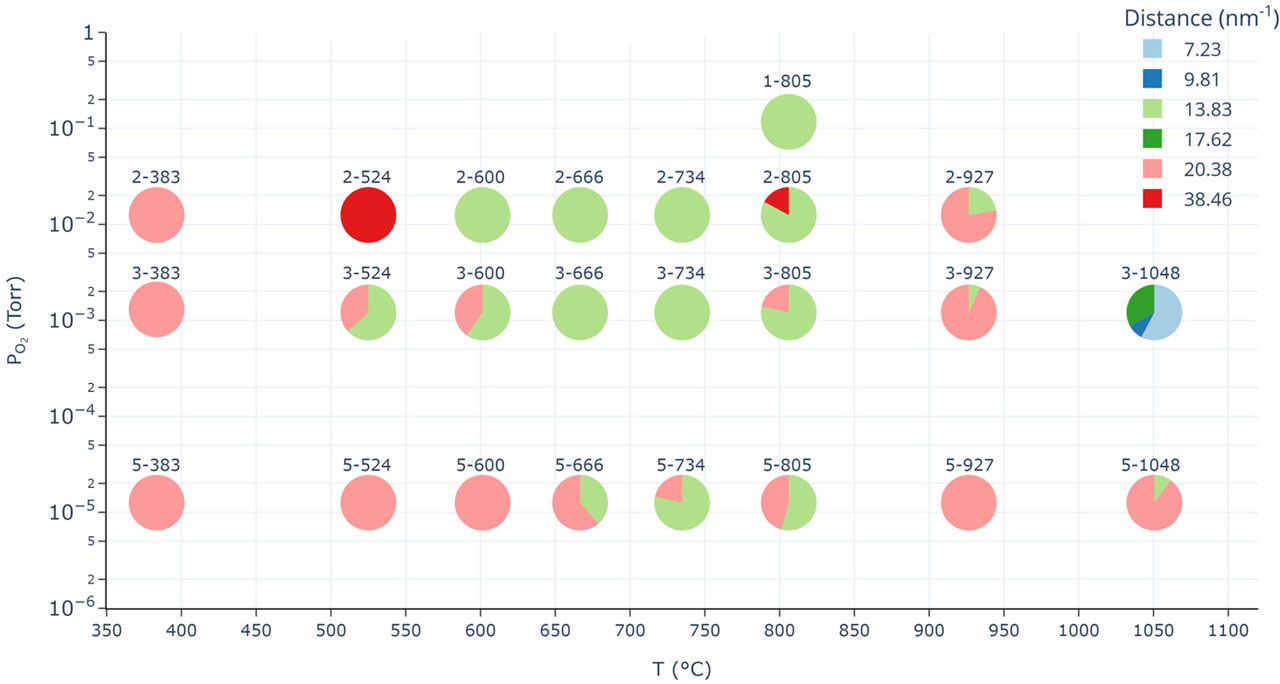
Fig. 2. A phase diagram constructed by automated RHEED pattern analysis for FeOx phase formation in thin films grown at various oxygen pressures and temperatures. The marker colors correspond to various lattice periodicities. The center region is mostly hematite (green), while magnetite (pink) appears at both low and high growth temperatures.
The mapping result shows that hematite Fe2O3 (green) dominates the film composition in the 600 to 800 °C range, while magnetite Fe3O4 (pink) appears at both lower and higher temperatures. This result was verified by later x-ray diffraction analysis. Under thermodynamic equilibrium conditions, a monotonic change from magnetite at higher growth temperatures to hematite at lower temperatures would have been expected. The non-monotonic phase composition variation shows the importance of kinetic effects in thin film growth.
The RHEED phase mapping thus produces an equivalent result to XRD analysis, but RHEED mapping can be done in-situ in near-real-time. The machine learning workflow thus creates a new way to use RHEED for automated phase formation analysis and real-time phase evolution tracking during thin film growth.
References
- [1] H. Liang, V. Stanev, A. G. Kusne, Y. Tsukahara, K. Ito, R. Takahashi, M. Lippmaa, and I. Takeuchi, Phys. Rev. Materials 6, 063805 (2022).