
Observation of Spontaneous X-ray Magnetic Circular Dichroism in the Chiral Antiferromagnet Mn3Sn Thin Film
Miwa and Nakatsuji Groups
Antiferromagnets without a net magnetic moment are invisible to many magnetic probes, including X-ray magnetic circular dichroism (XMCD). Recently, it was proposed that the inverse triangular spin (ITS) structure of a noncollinear antiferromagnet can give rise to finite XMCD signals through the non-vanishing magnetic dipole term T, which is probed by XMCD, even without net magnetization [1,2], as schematically shown in Fig. 1(a).
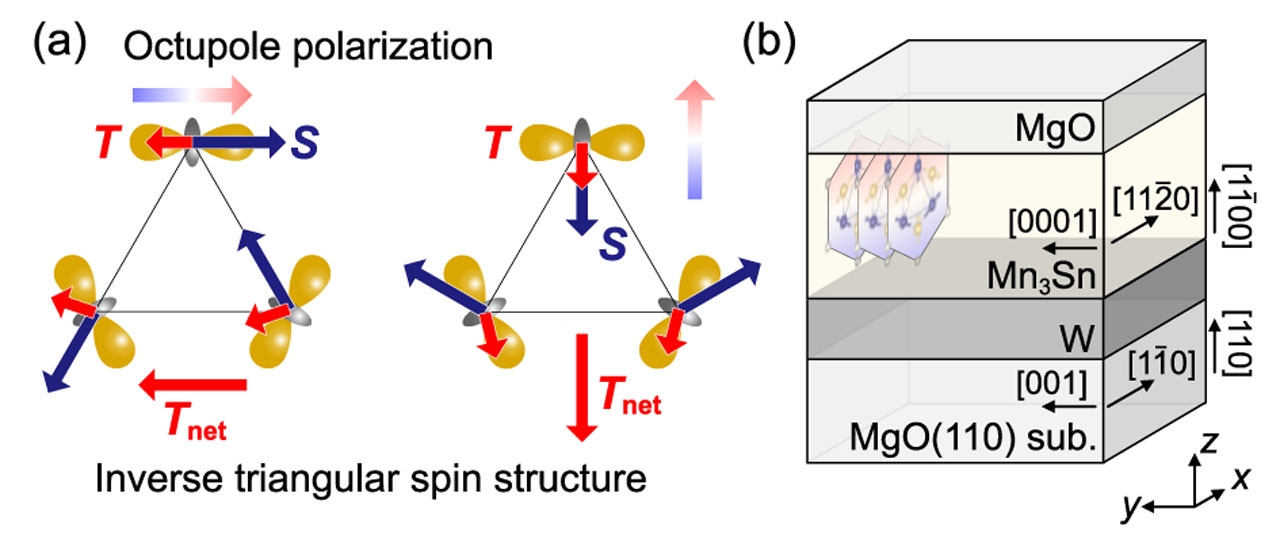
Fig. 1. (a) Inverse triangular spin (S) structure with magnetic dipole term (T). (b) Thin film structure.
A chiral antiferromagnet Mn3Sn with the D019 structure [3] is an ideal material for observing the XMCD signals originating from the ITS structure (also referred to as the ferroic order of cluster magnetic octupoles) because the direction of the ITS structure or the octupole polarization can be controlled by external magnetic fields through finite spin canting.
In the present study, to test if finite XMCD signals are observable in the ITS structure, we grew a Mn3Sn epitaxial thin film and performed XMCD measurements on it. The sample structure was MgO(110) substrate/W (15 nm)/Mn3Sn (40 nm)/MgO (3 nm), as schematically shown in Fig. 1(b). X-ray absorption spectroscopy (XAS) and XMCD measurements were performed on the BL-16A2 beamline at the Photon Factory. Measurement temperature was room temperature. The incident x-ray and magnetic field directions were perpendicular to the sample surface so that the octupole polarization becomes parallel to the incident x-rays.
Figure 2(a) shows a typical XAS spectrum of the Mn3Sn thin film. The XAS spectral line shape did not depend on the magnetic field strength or direction. The XMCD spectra obtained with magnetic fields of 0.1 T and 5 T are shown by the red and blue curves in Fig. 2(b), respectively. The spectral line shapes significantly differ from each other: The spectrum obtained with 0.1 T shows a strong positive pre-edge peak, denoted by α in Fig. 2(b), while the spectrum obtained with 5 T shows an intense negative peak at the XAS peak position, denoted by β in Fig. 2(b).
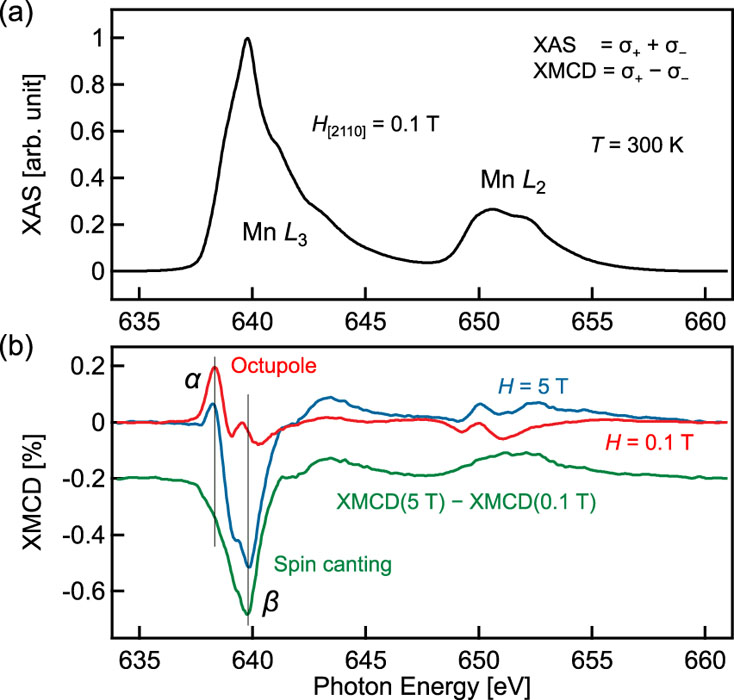
Fig. 2. (a) Typical XAS spectrum of the Mn3Sn thin film. (b) XMCD spectra taken with magnetic fields (H) of 0.1 T (red curve) and 5 T (blue curve). The spin canting component (green curve) is extracted by subtracting the 0.1 T spectrum from the 5 T spectrum.
The XMCD spectra are expected to consist of the spin-canting component, which develops with increasing magnetic fields, and the field independent octupole component. Because the peak β develops with increasing magnetic fields, it most likely originates from spin canting. Indeed, if the spectrum taken with 0.1 T is subtracted from the spectrum taken with 5 T, a broad featureless XMCD spectrum without peak α is obtained, as shown by the green curve in Fig. 2(b). This broad spectrum resembles the XMCD spectra of metallic systems, suggesting that it reflects the spin component. This argument also indicates that the spectrum taken with 0.1 T, which shows multiple sharp peaks, predominantly reflects the octupole component because it is independent of magnetic fields.
In summary, we demonstrated that the ITS structure can give rise to finite XMCD signals by performing XMCD measurements on a Mn3Sn epitaxial thin film [4]. This finding should allow one to quantitatively evaluate the magnitude of the octupole polarization and spin canting, which would be difficult otherwise. The present results should also lead to the resolution of antiferromagnetic domains and antiferromagnetic domain walls using the scanning XMCD technique.
References
- [1] Y. Yamasaki, H. Nakao, and T.-h. Arima, J. Phys. Soc. Jpn 89, 083703 (2020).
- [2] N. Sasabe, M. Kimata, and T. Nakamura, Phys. Rev. Lett. 126, 157402 (2021).
- [3] S. Nakatsuji, N. Kiyohara, and T. Higo, Nature 527, 212 (2015).
- [4] S. Sakamoto, T. Higo, M. Shiga, K. Amemiya, S. Nakatsuji, and S. Miwa, Phys. Rev. B 104, 134431 (2021).