
Bose-Einstein Condensation Superconductivity Induced by Disappearance of the Nematic State
Okazaki Group
The crossover from the superconductivity of the Bardeen-Cooper-Schrieffer (BCS) regime to the Bose-Einstein condensation (BEC) regime holds a key to understanding the nature of pairing and condensation of fermions. Figure 1a shows a canonical phase diagram of BCS-BEC crossover. Weak-coupling Bardeen-Cooper-Schrieffer (BCS) pairing and strong-coupling Bose-Einstein condensation (BEC) are connected continuously through the BCS-BEC crossover regime. This regime holds a key to understanding the nature of pairing and condensation of particles. In the weak-coupling BCS regime, the dispersion of the Bogoliubov quasiparticle (BQP) shows the characteristic back-bending near kF, which is downward convex around k = 0 in the case of a hole band below EF, as shown in Fig. 1b, where k is the crystal momentum of electrons. On the other hand, in the strong-coupling BEC regime, the dispersion with a minimum gap at k = 0 is expected, which is upward convex around k = 0 in the case of a hole band below EF, as shown in Fig. 1d. In the crossover regime, the BQP dispersion is intermediate between two extreme cases and the flat dispersion appears. In the crossover regime, a pseudogap is also expected to open at a temperature higher than Tc as a result of preformed bosonic pairs, as shown in Fig. 1a. Here, we provide systematic evidence for the BCS-BEC crossover in iron-based superconductors FeSe1−xSx from laser-excited angle-resolved photoemission spectroscopy, and show that the system enters the BEC regime with x = 0.21, where the nematic state that breaks the orbital degeneracy is fully suppressed.
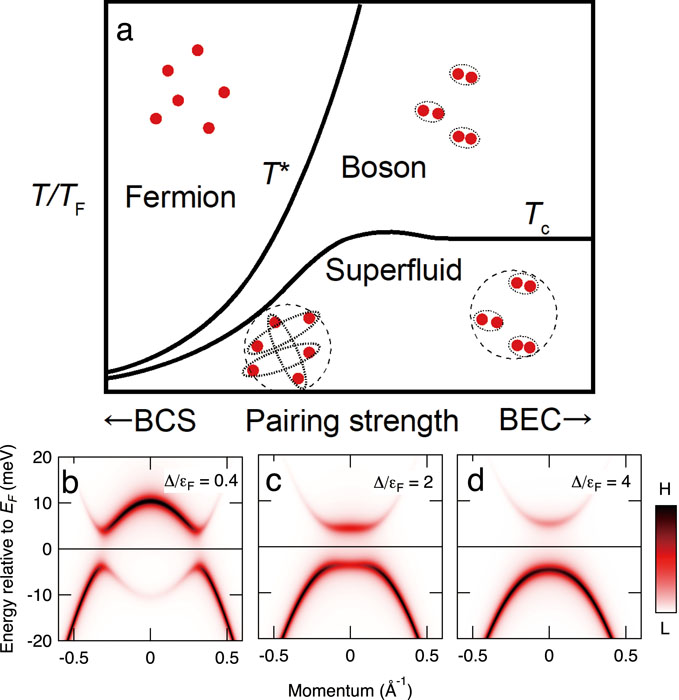
Fig. 1. Phase diagram of the BCS-BEC crossover and BQP band dispersions. (a) Canonical phase diagram of BCS-BEC crossover. Tc and T* are condensation and pairing temperatures, respectively. As the pairing strength increases, T* and Tc become separate, and a pseudogap is expected at T* > T > Tc. (b)-(d) BQP band dispersions in the BCS regime, the crossover regime, and the BEC regime, respectively. The dispersion is downward convex around k = 0 for the BCS regime, becomes flat in the crossover regime, and then becomes upward convex in the BEC regime, because of the chemical potential shift. Δ/εF is referred to as a measure of the pairing strength for single-band superconductors.
Figures 2a-2e show the ARPES intensity plots of FeSe1-xSex (where x = 0, 0.04, 0.13, 0.16, and 0.21) taken in the SC state with s-polarized light. To see the BQP band dispersions more clearly, we show enlarged plots around EF in Figs. 2f-2j. We have plotted the BQP band dispersions determined from the energy distribution curves (EDCs) of each composition as indicated by red markers. From these plots, we can see that the BQP band dispersion, which is downward convex at x = 0, systematically changes and becomes flat at x = 0.16; it then, eventually, becomes upward convex at x = 0.21. This systematic change is consistent with that expected from the chemical potential shift in the BCS-BEC crossover, as shown in Figs. 1b-1d, and thus strongly suggests that FeSe1−xSx is tuned from the BCS-BEC crossover regime (x = 0) to the BEC regime (x = 0.21). To obtain complete evidence for the BCS-BEC crossover, we have investigated the existence of a pseudogap, and found that the pseudogap appears at T* ~15 K for x = 0.21. Thus, from the BQP band and the existence of the pseudogap, we have concluded that BEC superconductivity is realized for x = 0.21. We have also investigated the substitution dependence of ∆/εF, where where ∆ and εF are the SC gap and the Fermi energy, respectively, and from the obtained substitution dependence, we have also concluded that the multiband nature is important for the realization of BEC superconductivity in this system, and that it is induced by the suppression of electronic nematicity.
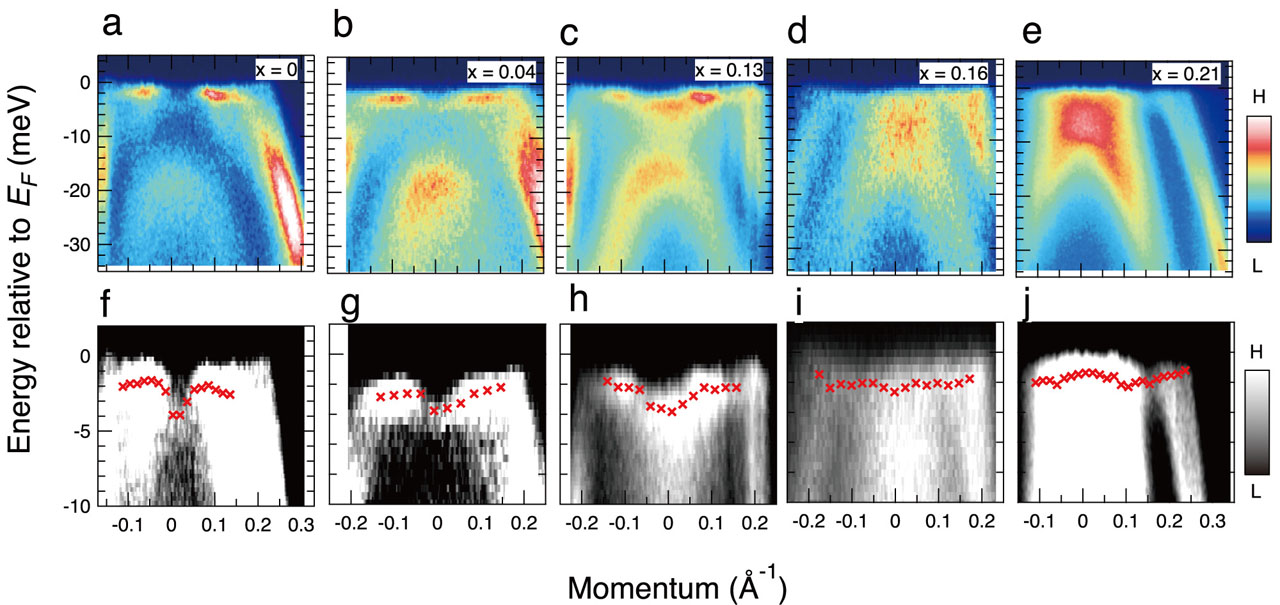
Fig. 2. ARPES intensity plots of FeSe1−xSx along the Γ−M direction measured in the SC state. (a)-(e) ARPES intensity plots of x = 0, 0.04, 0.13, 0.16, and 0.21 along the Γ-M direction taken at 2 K with s-polarized incident light. (f)-(j) Enlarged plots of (a)-(e) around EF. The red markers represent the BQP band dispersions determined from the energy distribution curves.
References
- [1] T. Hashimoto, Y. Ota, A. Tsuzuki, T. Nagashima, A. Fukushima, S. Kasahara, Y. Matsuda, K. Matsuura, Y. Mizukami, T. Shibauchi, S. Shin, and K. Okazaki, Sci. Adv .6, eabb9052 (2020).