Ultrafast Unbalanced Electron Distributions in Quasicrystalline 30° Twisted Bilayer Graphene
I. Matsuda, Okazaki, and Komori Groups
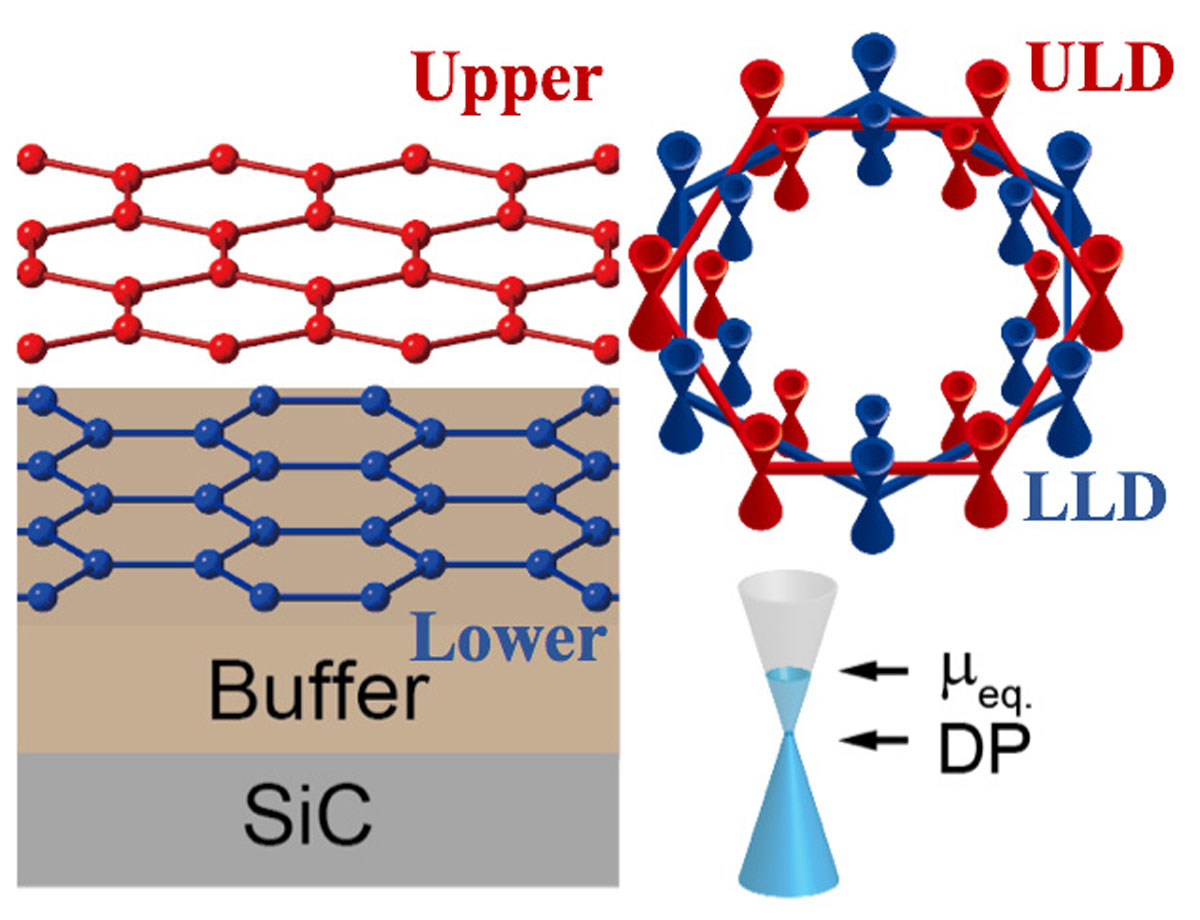
Layers of twisted bilayer graphene exhibit varieties of exotic quantum phenomena and the twist angle Θ has become an important degree of freedom for exploring novel states of matters. At Θ = 1.1°, the two-dimensional superconductivity was observed, while, at Θ = 30°, a two-dimensional quasicrystal is synthesized. For the quasi-crystalline twisted bilayer graphene (QCTBG), the interlayer interaction is the minimum due to the 30° twisted angle and the massless Dirac Fermions remain in the two layers. The electronic state results in the twelve-fold (dodecagonal) structure and it is composed of upper- and lower-layer Dirac cones, ULDs and LLDs, as shown in Fig. 1.

Fig. 1. Crystal and electronic structure of a twisted bilayer graphene quasicrystal on the SiC substrate. The upper- and lower-layer graphene sheets are twisted by 30 degrees with respect to each other. In the momentum space, electronic structure of a TBG quasicrystal is composed of the upper-layer Dirac (ULD) and lower-layer Dirac (LLD) bands. The inner-red and blue Dirac cones represent the replica bands of ULD and LLD bands by the umklapp scattering induced by the incommensurate interlayer stacking of the quasi-crystallinity. The quasi-crystalline twisted bilayer graphene was n-type: Dirac point and equilibrium chemical potential are denoted as DP and μeq, respectively.
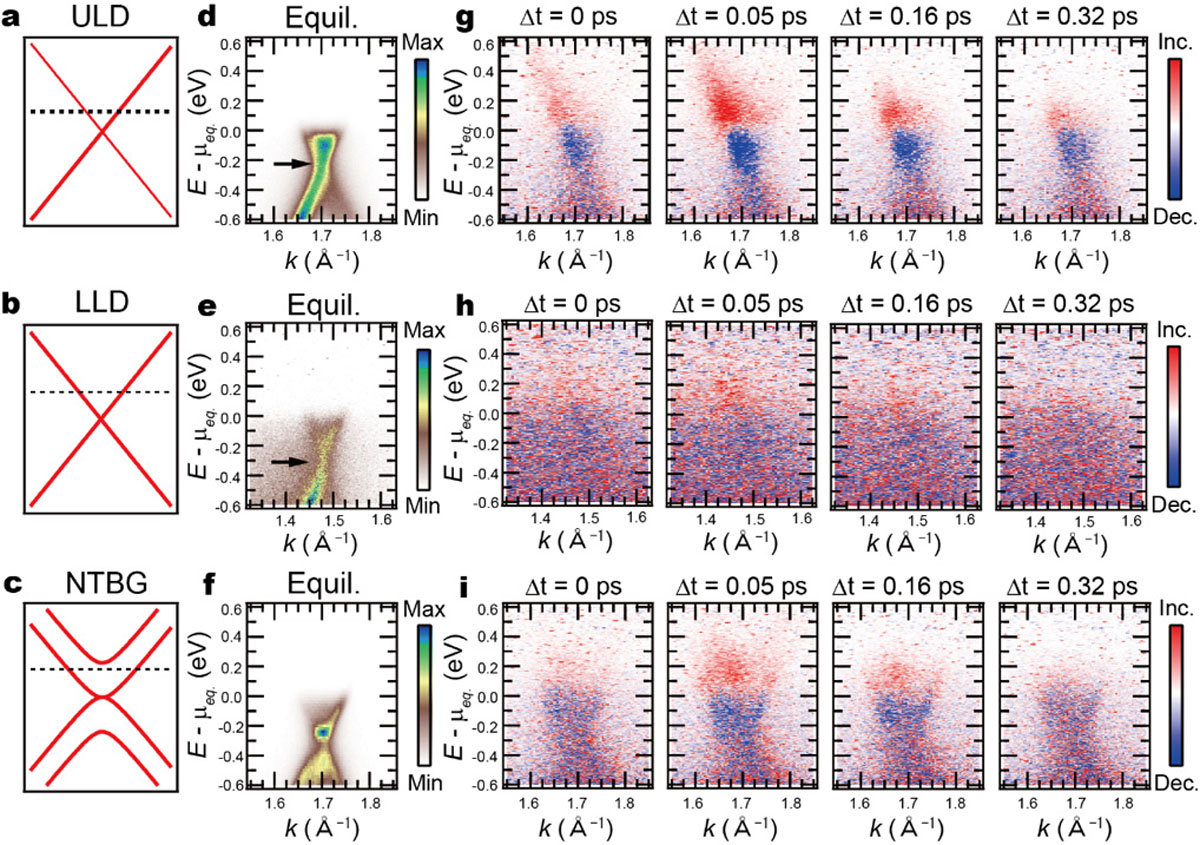
We explored this electronic structure by focusing on the ultrafast dynamics through time- and angle-resolved photoemission spectroscopy (TARPES), which allows us to directly observe the temporal evolution of fermions in the Dirac cones [1]. The measurement used the pump-probe approach with an infrared pulse with hv = 1.55 eV serving as pump and an extreme-ultraviolet pulse with hv = 21.7 eV serving as a probe to cover the entire two-dimensional Brillouin zone. Figure 2 shows a summary of the TARPES band diagrams taken at selected delay time for the ULD and LLD bands in a TBG quasicrystal. The results of the periodic non-twisted bilayer graphene (NTBG) are also shown for comparisons. After the pump pulse (intensity ~0.7 mJ/cm2), the TARPES band diagram of individual bands of bilayers evolves on the femtosecond time scale. To enhance the temporal variations, the band diagrams are shown as the difference between the spectra before and after photoexcitation. The spectral weights for all bands decrease immediately below μeq and increase above μeq at Δt= 0.05 ps. This reflects the excitation of electrons from the occupied bands to the unoccupied bands. At Δt= 0.16 and 0.32 ps, the difference intensity decreases with delay time, which corresponds to the relaxation of photoexcited carriers.

Fig. 2. Calculated band structures for the ULD and LLD bands in QCTBG and for non-twisted bilayer graphene (NTBG) band, respectively. Dashed lines indicate the μeq level. d–f, Equilibrium angle-resolved photoemission spectra for ULD, LLD, and NTBG bands. DP is indicated by an arrow. g–i, Difference images of TARPES for the ULD, LLD, and NBLG bands. Red and blue points represent increasing and decreasing photoemission intensity, respectively.
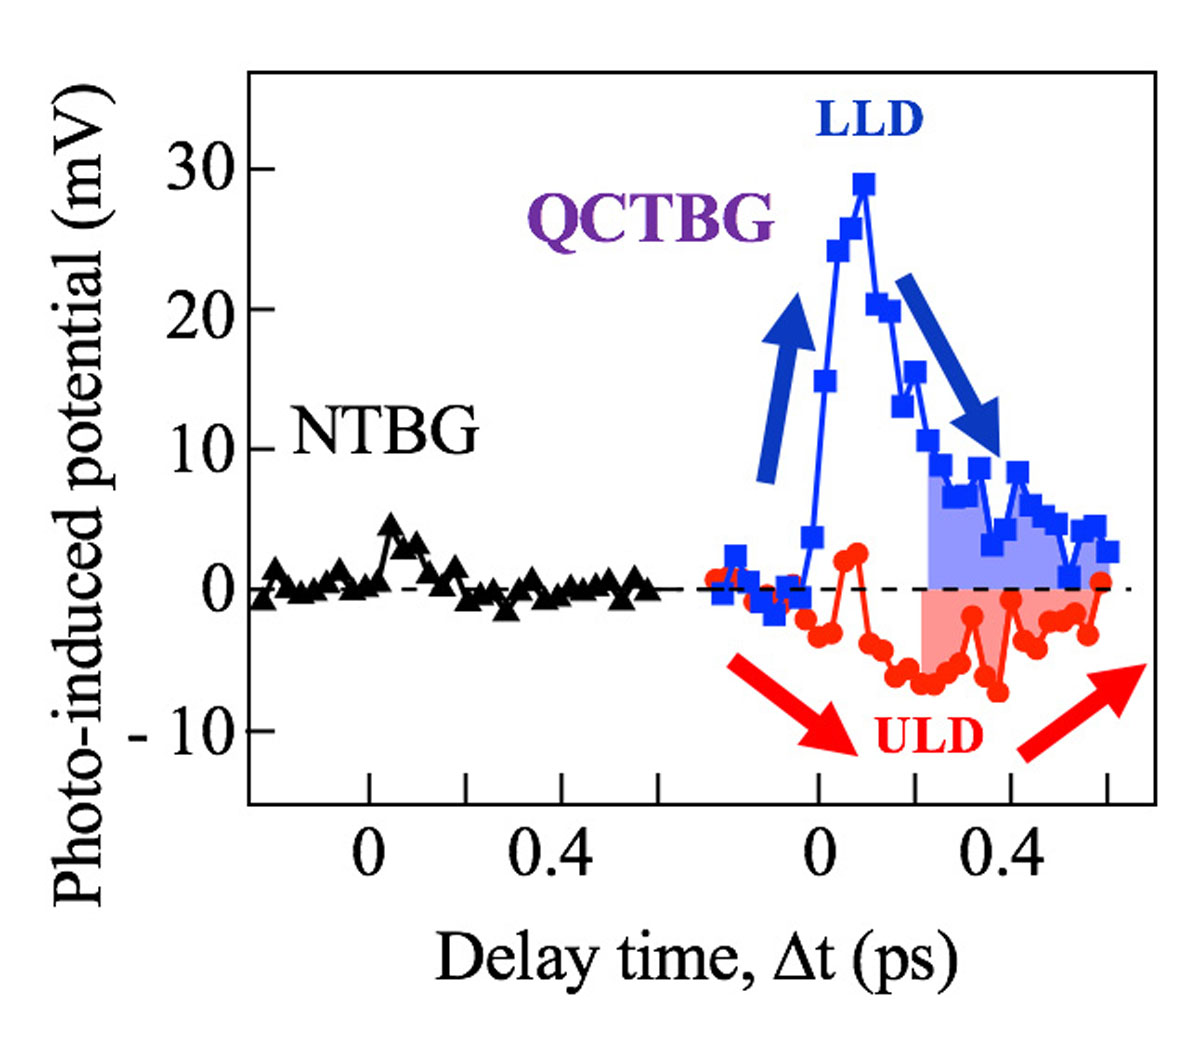
To evaluate the occupation of Dirac cones by nonequilibrium carriers, we made energy distribution curves of the Dirac bands by integrating over momentum space and summarized the chemical-potential shift or the photo-induced potential as Fig. 3. As shown in the figure, the different time evolution for potential indicates that the ULD and LLD bands have the opposite behavior after Δt = 0.2 ps (i.e. the ULD undergoes a negative shift whereas the LLD undergoes a positive shift). Interestingly, the photo-induced potential for the NTBG band remains constant at essentially zero over the same time delay. The striking difference among the three types of the Dirac cones provides clear evidence of a carrier imbalance between the ULD and LLD bands of the QCTBG on the ultrafast time scale. Through the kinetic analysis, the key mechanism was found to involve the carrier transport between layers and the transient doping from the substrate interface. Our TARPES measurements on replicas of the ULD and LLD bands, shown in Fig.1, revealed that the ultrafast dynamics scheme continues after the Umklapp scattering. The dynamics in the atomic layer opens the possibility of new applications and creates interdisciplinary links in the optoelectronics of van der Waals crystals.
References
- [1] T. Suzuki, T. Iimori, S. J. Ahn, Z. Yuhao, M. Watanabe, J. Xu, M. Fujisawa, T. Kanai, N. Ishii, J. Itatani, K. Suwa, H. Fukidome, S. Tanaka, J. R. Ahn, K. Okazaki, S. Shin, F. Komori, and I. Matsuda, ACS Nano 13, 11981 (2019).

