
Low-energy Excitations of Glassy Carbon Tetrachloride
Yamamuro Group
There remain many unsolved problems in physical properties of glasses. One of the most important problems is the low-energy excitations (LEE) characteristic to glasses. A broad excitation peak appears around 2-5 meV in most of Raman and inelastic neutron scattering (INS) spectra of glasses. This peak is usually called “boson peak” since the temperature dependence of the peak intensity is scaled well by Bose factors. This peak is basically due to a local excitation since the peak position does not depends on momentum transfer Q. Another interesting phenomenon is the phonon dispersion which has been observed in network glasses [1]. It seems strange that the glasses have phonon dispersion relations since they do not have periodicity. Nevertheless, broad dispersion-like excitations actually exist on dynamic structure factor S(Q,E) planes of glasses. The origins of the above phenomena should be associated with disordered (non-periodic) but locally-ordered structures of glasses. However, their microscopic mechanisms are still unknown.
An essential approach to the LEE problems is the INS study of molecular glasses with simple structures. The study enables us to make direct comparison with the results of various theoretical and computer simulation studies. Vitrification of simple molecules is not easy owing to their prompt crystallization on cooling. Hence we utilize the vapor-deposition (VD) technique whose cooling rate is estimated to be more than 107 Ks-1.
We have measured the INS spectra of VD carbon tetrachloride (CCl4) glass on AMATERAS, J-PARC. Fig. 1(a) shows the S(Q,E) data in the boson peak energy region. A clear boson peak appeared at around 2.5 meV in the glassy state while a sharper peak, which corresponds to the Debye cut-off of the acoustic phonon, at 4.5 meV in the crystalline state. The annealing at 50 K slightly reduced the intensity of the boson peak in the lower-energy side as observed in VD molecular glasses [2]. Fig. 1(b) gives the Q dependence of the boson peak intensity. The intensity has a clear hump at 2.3 Å-1 and 3.4 Å-1 which coincides with the second and third peak positions in S(Q). This is a similar Q dependence to that of the boson peak of SiO2 glass [3]. The phenomenon is roughly explained by a coupled rotation model of the SiO4 tetrahedral unit. Fig. 2 shows the S(Q,E)/Q2 color contour map of the data in which normal phonon contribution proportional to Q2 has been subtracted. It is of interest that, as shown by red curves, the phonon excitation has a clear dispersion relation starting at Q = 2.3 Å-1 where the boson peak intensity has a maximum and S(Q) exhibits the second peak. This is the first observation of the dispersion-like excitation in molecular glasses. We are now trying a normal mode analysis based on the local structure determined by the reverse Monte Carlo analysis on the X-ray diffraction data which was obtained in SPring-8.
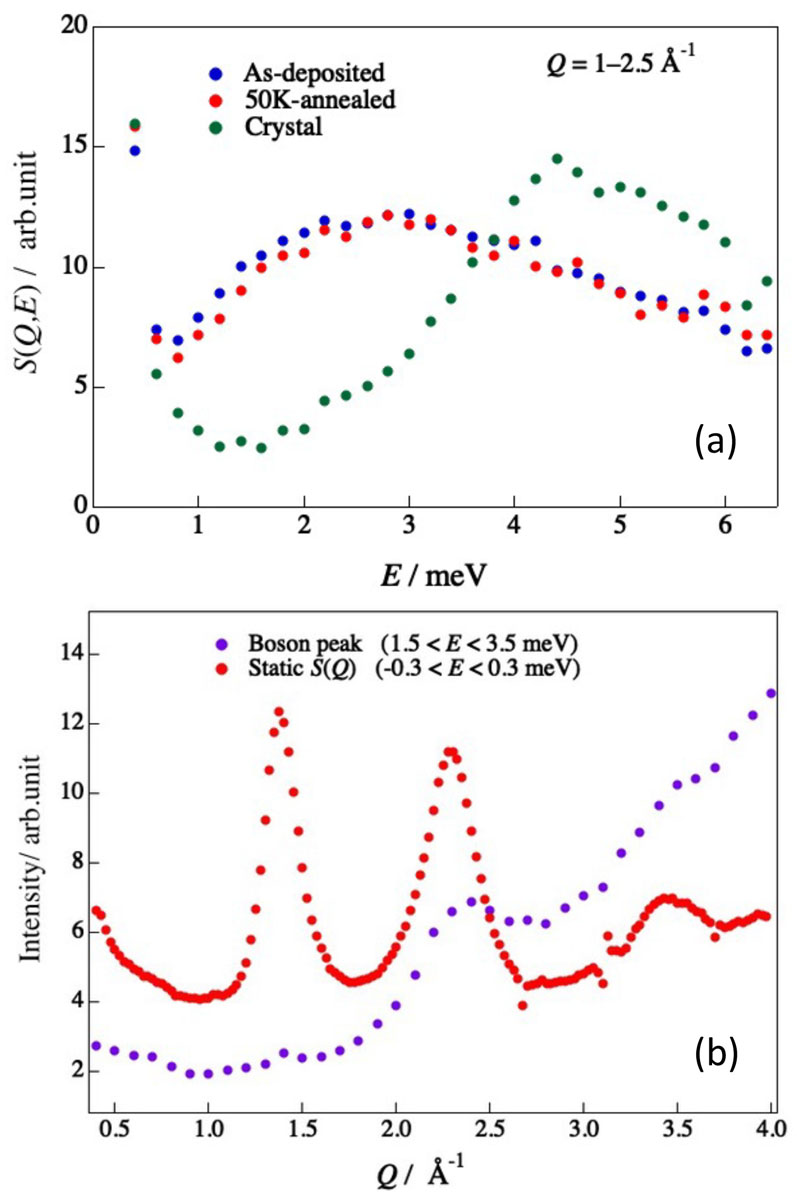
Fig. 1. (a) Inelastic neutron scattering spectra of two glassy and one crystalline states of CCl4 at 6 K. (b) Q dependence of the boson peak intensity integrated over E = 1.5–3.5 meV. Structure factor S(Q) of glassy CCl4 is also plotted.
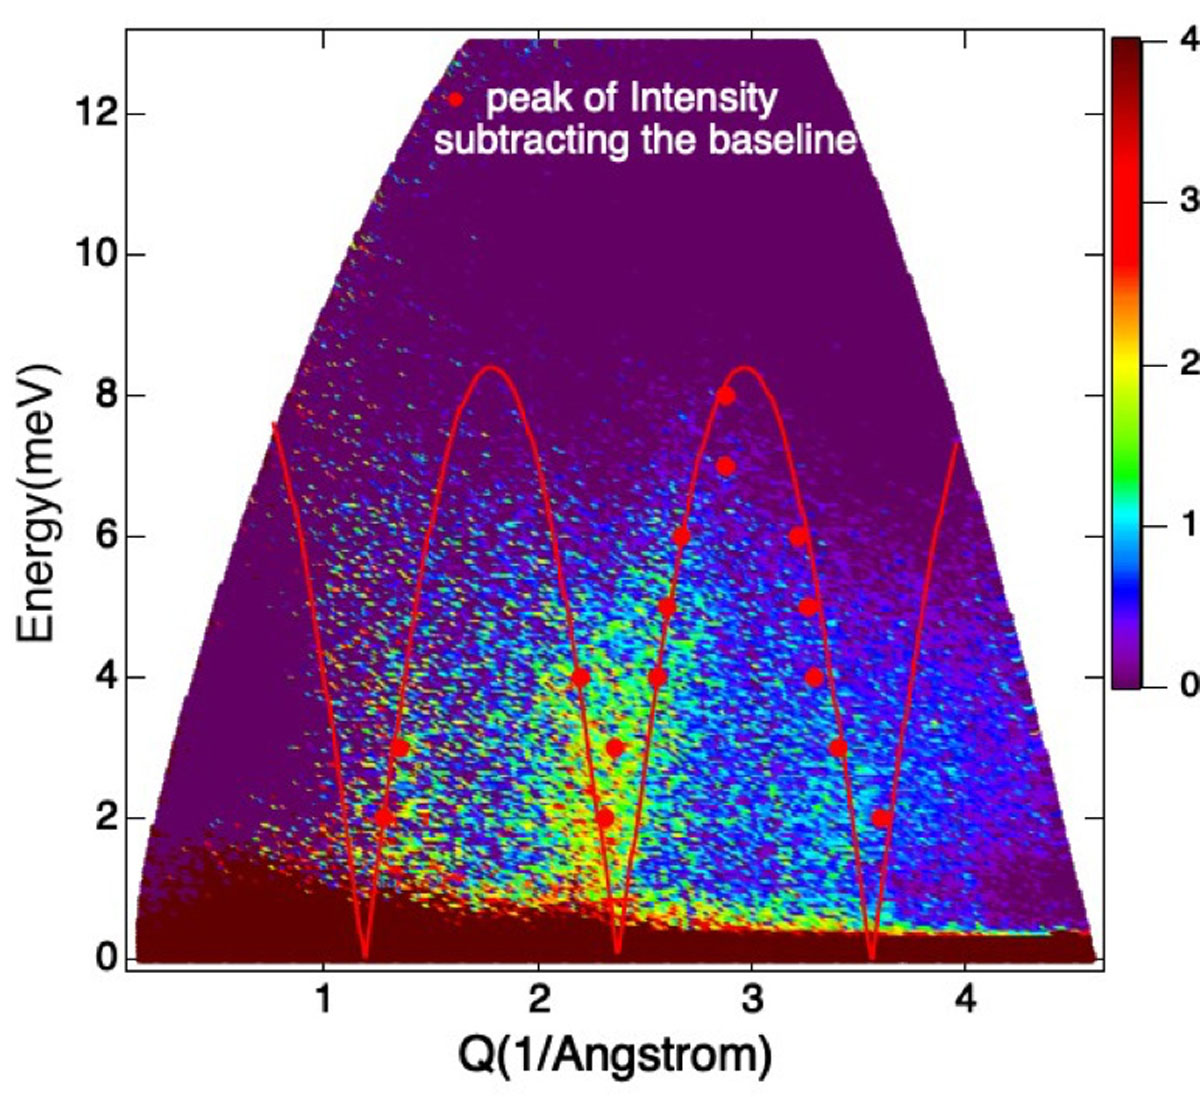
Fig. 2. S(Q,E)/Q2 color contour map of the glassy CCl4 data at 6 K from which normal phonon contribution proportional to Q2 has been subtracted in advance.
References
- [1] M. Arai, Y. Inamura, T. Otomo, N. Kitamura, S. M. Bennington, and A. C. Hannon, Physica B 263, 268 (1999).
- [2] O. Yamamuro, I. Tsukushi, T. Matsuo, K. Takeda, T. Kanaya, and K. Kaji, J. Chem. Phys. 106, 2997 (1997).
- [3] U. Buchenau, M. Prager, N. Nücker. A. J. Dianoux, N. Ahmad, and W. A. Phillips, Phys. Rev. B 34, 5665 (1986).