
3D Liner Imploding Process in the Electro-Magnetic Flux Compression
Takeyama Group
The electromagnetic flux compression (EMFC) technique in ISSP has been established to generate magnetic fields up to 730 T [1], which is the world strongest magnetic field in an indoor experiment. There, a metallic cylinder called the “liner” is subjected to the inductive electromagnetic force from a primary coil, and the initial magnetic field (~4 T) is compressed by an imploding liner within a few microseconds before the magnet destruction. Owing to the high reproducibility in its operation of the EMFC technique, solid-state physics experiments are nowadays available in ultra-high magnetic fields of up to 700 T at room temperature and up to 600 T at temperatures as low as 5 K. For solid-state physics experiments performed under ultra-high magnetic fields, the particularly important issues are (a) high precision of the magnetic field intensity, (b) the spatial uniformity of the magnetic field, and (c) appropriate bore at a peak magnetic field. For issue (a), the magnetic field intensity was recently verified to have a precision of 3 % up to 500 T, by calibrating with the Faraday rotation measurement on optical glasses [2]. For issues (b) and (c), detailed knowledge of dynamical magnetic-flux compression processes is required, for which computer simulation can be a powerful tool. Thus, we clarified the relationship between the liner’s imploding process and the spatiotemporal distribution of the magnetic field intensity, by comparing with the simulation [3].
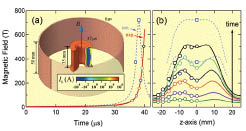
Fig. 1. (a) Magnetic field curves of the experiment (the solid curve, Llin = 50 mm) and the simulation (the dashed curve, Llin = 35 mm). The inset illustrates the liner’s shape. For t = 0 μs, we show the liner used in the experiment (Llin = 50 mm). For t = 37 μs, the simulated imploding liner in case of Llin = 35 mm deforms into a barrel-like shape. The color map indicates the secondary current intensity, Is, induced in the liner. (b) Spatial profiles of magnetic field intensity along the magnetic field axis at each time, which corresponds with the open symbols in (a). The solid-curves are the fitting of two Gaussian functions for the experimental data, and the dashed curves are the simulated spatial profiles in case of Llin = 35 mm.
In Fig. 1(a), the solid curve is the magnetic field intensity curve (hereafter termed as the B-t curve) at z = 0. We adopted the liner of 50 mm length (Llin, illustrated in the inset) and of 1.5 mm thickness. A multi-probe with an eight pick-up coils were set along the magnetic field axis (defined as the z-axis) at the center of the imploding liner, and the spatial distribution of the magnetic field intensity was simultaneously measured in a single shot The magnetic field’s profile in the z direction, B(z), was shown in Fig. 1(b). The field homogeneity was thus successfully determined for the first time in the EMFC experiment. Up to 500 T, the field homogeneity was estimated as good as the measurement error (~3 %) at z = ±1 mm, which has proven to be sufficiently good for the general solid-state physics measurements.
Two-hump structure of B(z) in Fig. 1(b) is hardly explained by the mesh modeling of liner’s dynamics developed by Miura and Nakao [4]. In Ref. 4, the liner’s thickness was assumed to keep uniform along the z direction during the implosion. However, their model is far from accuracy in describing the real situation and is oversimplified. Therefore, we revised the simulation by independently calculating the dynamics of the liner mesh with its respective z coordinate, which allows us to obtain a nonuniform liner deformation.
The dashed curves in Figs. 1(a) and 1(b) are the simulation result in case of Llin = 35 mm. The length of the primary coil (Lpri) is set to be 45 mm. The simulated liner’s shape at 37 μs is illustrated in the inset of Fig. 1(a), and the color map indicates the secondary current intensity, Is, induced in the liner. The barrel-like deformation of liner’s inner wall shown in Fig. 1(a) induces the two hump structure of B(z) in Fig. 1(b). Note that the liner’s barrel-like deformation only takes place when Llin < Lpri, whereas Llin (50 mm) > Lpri (45 mm) at t = 0 μs in the real experiment. This fact implies a three-dimensional implosion process associated with a compression of the liner along the z-axis. The present work has pointed out that a three-dimensional analysis of an imploding liner is of particular importance for further record-breaking higher magnetic field in the EMFC, and for an increased controllability as well as a higher precision in the solid-state physics measurements.
References
- [1] S. Takeyama and E. Kojima, J. Phys. D: Appl. Phys. 44, 425003 (2011).
- [2] D. Nakamura et al., Rev. Sci. Instrum. 84, 044702 (2013).
- [3] D. Nakamura, H. Sawabe and S. Takeyama, Rev. Sci. Instrum. 85, 036102 (2014).
- [4] N. Miura and K. Nakao, Jpn. J. Appl. Phys. 29, 1580 (1990).