
Glass Transition of Hydrogen Atoms in Palladium Lattice
Yamamuro Group
Palladium hydride (PdHx) is the most popular metal hydride which has been investigated by many physicists and chemists. It has been remarked also from industrial points of view, e.g., hydrogen storage, filters, sensors, catalysts, etc. Figure 1 shows the adsorption isotherm of the Pd and hydrogen gas system [1]. On adsorption, a hydrogen molecule (H2) dissociates into two hydrogen atoms (2H). It is known that the α phase appears in a lower concentration (x) region while the β phase in a higher x region. In the intermediate region (dome-like area of Fig. 1), the α and β phases coexist and pressure becomes constant according to the Gibbs phase rule. Above the critical point (2.0 MPa, 259ºC), one cannot distinguish the α and β phases. Both α and β phases have an fcc structure. Most of the H atoms are located at the octahedral sites in the β phase, while the positions of the H atoms are not known in the α phase. The volume of the β phase is 11% larger than that of the α phase. There are still many unsolved interesting problems in PdHx, e.g., superconductivity at a higher x region, a surface ferromagnetic phenomenon, etc. The present work is associated with a mysterious phenomenon called “50 K anomaly”. We have measured the heat capacity of the β phase with various x using an adiabatic calorimeter which was modified for in situ introduction of hydrogen gas into the sample cell.
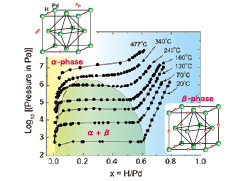
Fig. 1. Adsorption isotherms of Pd-H system and schematic structure of the α and β phases of PdHx.
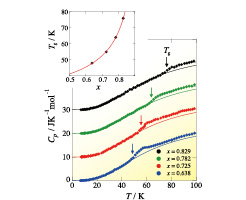
Fig. 2. Heat capacities of PdHx (x = 0.638, 0.725, 0.782, 0.829). The arrows represent the glass transition temperatures Tgs whose x dependence is shown in the inset. The curves in the Cp and Tg figures represent the results of the fittings to Eqs. (1) and (2), respectively. See text for the details.
Figure 2 shows the heat capacities of PdHx (x = 0.638, 0.725, 0.782, 0.829). For all of the samples, a heat capacity anomaly appeared around 50 K as expected from the previous work [2, 3]. We have fitted the data at temperatures lower than the anomaly to the function,
Cp = C(Debye) + C(Einstein) + γT, (1)
where the first and second terms correspond to the acoustic and optical vibrations, respectively and the third term represents the electronic heat capacity. It was revealed that C(Einstein) does not contribute in this temperature range since the mass of an H atom is much smaller than that of a Pd atom. The coefficient γ was determined not by the fitting but by the interpolation for the previous heat capacity data at very low temperatures [4]. The fitting was satisfactory for all samples as shown in Fig. 2. The Debye temperature θD determined by the fitting is 246 K, being mostly independent from x in the β phase. This value is smaller than that of pure Pd (θD = 276 K), meaning that the Pd lattice is softened by accommodating H atoms. In the previous studies [2, 3], the 50 K anomaly was treated as a Cp peak. From the precise analysis, however, it was found that this is a step-like anomaly. We also found that an exothermic, followed by endothermic, phenomenon appeared around the anomaly. Taking its temperature dependence and annealing effect into consideration, we conclude that the 50 K anomaly of PdHx is not a phase transition but a glass transition that is a freezing phenomenon of the H atoms positionally disordered among the octahedral sites. This conclusion is supported by the previous NMR [5], mechanical [6], thermal relaxation [7] studies which show that the relaxation time of the jump motion of the H atoms reaches 1000 s (the time-scale of the glass transition) around 50 K.
Figure 2 demonstrates that the glass transition temperature Tg strongly depends on x. By assuming that the jump rate of the H atoms is proportional to the number of vacant sites and the Arrhenius relation is valid in this region, we derived the following equation,
Tg = ΔE/[ln(1 - x) + A]. (2)
where ΔE is the activation energy and A is a constant. The x dependence of Tg is reproduced well as shown the inset of Fig. 2.
We are now planning to measure the heat capacity of the PdDx sample with expectation of isotope effects on the 50 K anomaly. It is possible to observe an ordering transition of the D atoms since the previous neutron diffraction works using PdDx samples suggest some sort of ordering of the D atoms below 50 K.
References
- [1] F. D. Manchester, Phase Diagrams of Binary Hydrogen Alloys, p.158 (2000).
- [2] D. M. Nace and G. J. Aston, J. Am. Chem. Soc. 79, 3627 (1957).
- [3] H. Araki, M. Nakamura, S. Harada, T. Obata, N. Mikhin, V. Syvokon, and M. Kubota, J. Low Temp. Phys. 134, 1145 (2004).
- [4] C. A. Mackliet and A. I. Schindler, Phys. Rev. 146, 463 (1966).
- [5] D. A. Cornell and E. F. W. Seymour, J. Less-Common Met. 39, 43 (1975).
- [6] J. K. Jacobs, C. R. Brown, V. S. Pavlov, and F. D. Manchester, J. Phys. F: Metal Phys. 6, 2219 (1976).
- [7] J. K. Jacobs and F. D. Manchester, J. Phys. F: Metal Phys. 7, 23 (1977).