
Spatial mapping of Ferromagnetic Resonance using a Radio-Frequency Probe
Hasegawa Group
Recent developments in microelectronic devices and spintronics lead researchers to the task of local characterization of the dynamical response in small magnetic structures and devices. Local measurement of ferromagnetic resonance (FMR), which can have quantized or localized modes due to sample boundaries, is one of the fascinating topics among them. Recently we have developed a radio-frequency (RF) probe with which one can locally excite FMR and detect its response. Using the probe, three kinds of FMR absorption signals were detected on a ferromagnetic disk, and spatial distribution of their intensity were imaged. These results demonstrate the potential of the local probe for spatially resolved FMR microscopy.
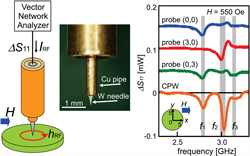
Fig.1. Schematic of the RF probe and FMR signals detected on a YIG disk sample with the RF probe and a coplanar waveguide (CPW) located under the disk.
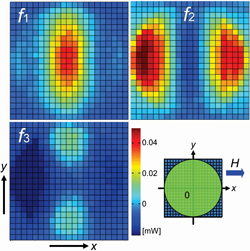
Fig.2. Two dimensional mapping of the FMR signal intensities of the detected three modes; f1, f2, and f3.
Figure 1(a) shows a schematic of our RF probe, an open-ended coaxial cable that transmits RF over 10 GHz with a sharp tungsten needle attached on its end. For the signal detection, the probe was located close to a sample in a typical distance of 0.1 mm. The RF current from the probe generates circular RF magnetic field in the sample, and its orthogonal component to static magnetic field H applied in the in-plane direction to the sample surface excites the magnetization. When the RF coincides with the FMR frequency, the resonance response appears as an absorption in the reflection spectrum (ΔS11) measured with a network analyzer.
Figure 1(c) shows the absorption spectra taken by our RF probe at the three different positions on a polycrystalline Al-doped yttrium iron garnet (YIG) disk; one at the center of the disk, and the other two at the off-center sites. One can clearly recognize a resonance signal as an absorption dip at the frequency of f1, f2, and f3, and notice whether the absorption signals are observed or not depends on the sites. The RF reflection spectrum we measured as a reference using a coplanar waveguide (CPW) located under the YIG sample, which detects FMR of its entire area, shows all the three signals, demonstrating the capability of the RF probe to locally detect the FMR signals.
By utilizing the scanning capability, we investigated the spatial dependence of the detected FMR signals, as shown in Fig. 2. Two-dimensional mapping of the absorption intensity for each signal clearly reveals node structure of each excited mode; no node for the f1 mode, one node in the direction perpendicular (parallel) to H in the f2 (f3) modes. The spatial distribution and the frequency relation of the three modes lead us to identify f1 and f2 as magnetostatic backward volume wave (MSBVW) mode and f3 as magnetostatic surface wave (MSSW) mode or the Damon-Eshbach (DE) mode excited in the sample.
Although the spatial variation of the FMR detection is in millimeter range at the present moment, because of the sample size and the nature of the excited waves, the spatial resolution of the RF probe itself should be better. The spatial resolution for detecting FMR using an open-ended probe has been estimated to be an order of the tip curvature, which can be down to nanometer dimensions. We thus believe that this method will be a nanometer-scale imaging method of FMR, which is not accessible by the other techniques.
References
- Toshu An, et al. IEEE Magnetics Letters, 1 3500104 (2010).