
Modulation of Electron-Phonon Coupling in One-Dimensionally Nanorippled Graphene
Komori Group
Electron-phonon coupling plays various roles in solids such as inducing phase transitions and electron energy relaxation. In graphene, it is actually one of the dominant sources of the energy relaxation, and can be locally detected by tunneling spectroscopy with scanning tunneling microscopy as an increase of the tunneling current at the absolute value of the sample-bias voltage corresponding to the phonon energy through an inelastic tunneling (IET) process [1]. We have studied local electron-phonon coupling of a one-dimensionally (1D) nanorippled graphene (3.4 nm period) [2] .
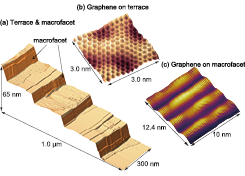
Fig. 1. STM images of graphene grown on a vicinal SiC(0001) substrate. (a) Wide image indicating terrace and macrofacet structure of the substrate. 1D undulation can be seen on the macrofacets (b) Graphene honeycomb lattice on the terrace. (c) 1D periodically-undulated graphene on the macrofacet.
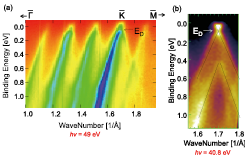
Fig. 2. ARPES spectra using 49 eV (a) and 40.8 eV (b) photons. Four replica bands are seen as well as the true graphene Dirac band in (a). The separation of the bands is consistent with the period of the 1D undulated graphene. Using 40.8 eV photons, the signal from the subsurface graphene nanoribbons was detected in (b).
The sample was prepared on a vicinal SiC(0001) substrate by thermal decomposition in an Ar atmosphere. Local atomic and electronic structures of the graphene were characterized using scanning tunneling microscopy/spectroscopy (STM/STS), and the phonon signals were locally detected by IET spectroscopy.
Figure 1 shows STM images of the surface, which consists of terraces and macrofacets of 27° off from the (0001) surface. The macrofacet surface is covered by continuous graphene with 1D periodic undulation. The 1D super periodicity of the graphene is evidenced by satellite band signals in the angle-resolved photoemission spectroscopy (ARPES) images of the graphene Dirac band from the macrofacet shown in Fig. 2(a). ARPES signals from the second-layer graphene were clearly observed using 40.8 eV photons as in Fig. 2 (b). Thus, the interface between surface graphene and the SiC substrate consists of alternate nanoribbons of graphene and the carbon buffer layer.
In the STS measurement, we observed IET signals due to phonons in the vertical direction of the graphene plane. The signal intensity periodically oscillates in the 1D undulation direction of graphene with the same periodicity. This means that the intensity of the inelastic scattering due to the electron-phonon interaction oscillates in the tilting direction of the macrofacet. Since the STM image of the graphene surface looks uniform, we conclude that the IET intensity oscillation is attributed to the subsurface interface layer. The tunneling electrons are easy to move from the surface graphene to the second layer graphene nanoribbon, but not to in the buffer layer because of the long interlayer distance. Due to this difference, the probability that tunnel electrons interact with the phonon system is larger on the buffer layer.
References
- [1] C.-H. Kim et al., Nature Phys. 4, 213 (2008).
- [2] K. Ienaga et al., Nano. Lett. 17, 3527 (2017).