
Formation and Structure of Carbon Dioxide Glass
Yamamuro Group
Glass can be recognized as the ‘fourth state of matter’ following gas, liquid, and solid. Compared with the conventional three states, glass is more mysterious and leaves many unsolved problems from the viewpoint of physics. One of the most important problems is the ‘basic structure of glasses’. Is it similar to the local structure of the corresponding crystal or characteristic of the glass such as an icosahedral cluster? This problem is recently remarked more and more as it has been understood that the mechanism of the glass transition is deeply associated with the local and/or medium-range structures of glasses.
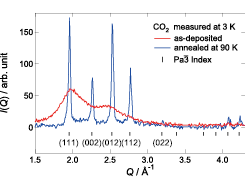
Fig. 1. X-ray diffraction patterns of the vapor-deposited CO2 measured at 3 K. The red and blue curves represent the data of the as-deposited and 90 K-annealed samples, respectively. The tick marks with Miller indices show the peak positions calculated from the crystalline data [7] with a space group Pa-3.
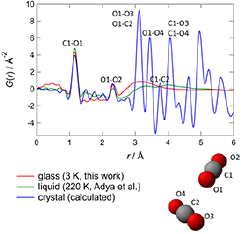
Fig. 2. Pair distribution functions for glassy, liquid, and crystalline CO2. The nearest neighbor configuration in crystalline CO2 is schematically shown below the graph. The label corresponding to each atomic correlation is depicted in the graph.
For metallic glasses, a bulk glass of tantalum (Ta) was experimentally obtained recently [1] and its structure was confirmed to be an aggregate of icosahedral clusters from the molecular dynamics simulation [2]. On the other hand, for simple molecular glasses which additionally have an orientational degree of freedom, there have been few structural works since their glass transition temperatures are very low and they are readily crystallized on cooling. Our group has formed several simple molecular glasses by means of a vapor deposition (VD) method, and investigated their thermal and structural properties [3-6]. The vapor-deposition is the most rapid cooling method, in which molecules at a gas state are condensed on a cold substrate. The cooling rate is estimated to be higher than 107 Ks-1. In this work, we have tried to form a CO2 glass, which has never been vitrified.
The red curve in Fig. 1 shows the X-ray diffraction pattern of the as-deposited sample measured at 3 K. This data clearly exhibits a typical halo pattern characteristic of amorphous structures, indicating that the amorphous form of CO2 was successfully prepared by the VD method. We would like to emphasize that this is the simplest molecular glass ever realized. On heating the VD sample, many Bragg peaks, which are a direct evidence of crystallization, appeared at 25 K. To obtain the complete crystalline state, the sample was annealed at 90 K for 5 min and then cooled again to 3 K. The blue curve in Fig. 1 presents the diffraction pattern of the annealed sample exhibiting sharp Bragg peaks. The peak positions are well reproduced in terms of the reported crystal structure (space group Pa-3) [7] as shown by the tick marks in Fig. 1.
Figure 2 shows the pair distribution functions G(r) of glassy, liquid, and crystalline CO2. The former two were obtained by the Fourier transformation of the observed diffraction data and previous data on liquid CO2 at 220 K and 0.85 MPa [8]. The G(r) of crystalline CO2 was calculated from the crystal data [7]. The configuration of the neighboring two CO2 molecules in the crystalline state is also depicted in Fig. 2. The peaks around 1.15 Å and 2.3 Å, which are common in all states, correspond to the C-O and O-O correlations within a molecule, respectively. The G(r) of the glassy sample exhibits a peak around 3.1 Å, while that of the liquid sample broader peaks around 3.3 Å and 4.0 Å. It is noteworthy that the peak position of the glassy sample (3.1 Å) coincides with the shortest intermolecular correlation (O1-C2, O1-O3) in the crystalline state. This indicates that the glassy CO2 has a strong intermolecular correlation which is similar to that in crystalline CO2. This is the first experimental evidence for the basic structure of glasses.
References
- [1] L. Zhong et al., Nature 512, 177 (2014).
- [2] J. C. Zhang et al., Mater. Des. 77, 1 (2015).
- [3] O. Yamamuro et al., Europhys. Lett. 63, 368 (2003).
- [4] O. Yamamuro et al., J. Chem. Phys. 115, 9808 (2001).
- [5] O. Yamamuro et al., J. Chem. Phys. 106, 2997 (1997).
- [6] S. Tatsumi et al., Phys. Rev. Lett. 109, 045701 (2012).
- [7] A. Simon et al., Acta. Cryst. B36, 2750 (1980).
- [8] A. K. Adya et al., Mol. Phys. 77, 1217 (1992).