
Observing Hot Carrier Distribution in an n-type Epitaxial Graphene on a SiC Substrate
H. Fukidome and I. Matsuda
A monolayer graphene is "supermaterial" that is the thinnest, lightest, and strongest material with ultrahigh electrical and thermal conductivity. Recently optical properties of the graphene have also attracted interests in the field of developing optoelectronic, plasmonic and nanophotonic devices. However, detailed mechanisms of the photo-induced phenomena of a graphene, such as the multiple carrier generation, have not been understood and, thus, the direct investigation of the non-equilibrium carrier dynamics has been strongly called for.
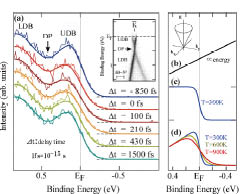
Fig. 1. (a) Comparison of the spectra at different delay times. The experimental spectra were taken at a photon energy of 28.26 eV at various delay times with pumping laser irradiation (hν=3.14 eV). The intensity variation for the UDB is clearly reproduced by the simulated result (d) while the intensity for the LDB is unchanged. The inset shows dispersion of the Dirac bands near the Fermi level (EF). The upper Dirac band (UDB) and lower Dirac band (LDB) are labeled in the figure and the Dirac Point (DP) is indicated by an arrow. (b)–(d) Simulation of energy spectra for two cases of Dirac free electrons. The inset shows their two-dimensional band dispersion. (b) density of states, (c) Fermi–Dirac function, and (d) resulting spectra.
In the present research, we carried out femtoseconds(fs)-time- and angle-resolved photoemission experiment to observe the temporal variation of the Dirac electrons after the optical pumping in real time. The measurement was carried out using high-harmonic generation (HHG) laser system based on the Ti:Sappire laser (hν=1.57 eV). Photon energy of 28.26 eV for the HHG laser pulse is generated by irradiating the second harmonic laser pulses (hν =3.14 eV) at Ar gas and it is high enough to cover the electron momentum of the Dirac band at the K point in angle-resolved photoemission measurement. The time-resolved data were obtained using the pump (3.14 eV laser) and probe (HHG) method with a repetition rate of 1 kHz.
Figure 1(a) shows a series of angle-integrated spectra taken with a laser pumping power of 2.5 mW at various delay times. Dispersion of the Dirac bands, observed by angle-resolved photoemission at the K point, is shown in the inset. With laser pumping (t=0), the photoemission intensity of the upper Dirac band (UDB) decreases significantly while that of the lower Dirac band (LDB) remains constant. Around the energy corresponding to the Fermi energy, the spectral tail extends in energy. The slope of the spectral edge also becomes small. At each delay time, the raw experimental data, drawn with thin colored lines, are curve-fitted with a function that is a product of density of states of graphene, Fig. 1 (b), and the Fermi-Dirac function, Fig. 1(c). In the spectral simulation of Fig. 1 (d), the Fermi edge shows a peak-like structure, and the peak top shifts toward higher binding energy at higher temperature. In Fig. 1(a), the fitting results are drawn through raw experimental data with bold colored lines. The temporal evolution in Fig. 1(a) is described by comparing it with the intensities simulated in Fig. 1(d) , and it reflects the time evolution of the electronic temperature, that is, the transient distribution of the hot carriers (electrons).
References
- [1] T. Someya, H. Fukidome, Y. Ishida, R. Yoshida, T. Iimori, R. Yukawa, K. Akikubo, Sh. Yamamoto, S. Yamamoto, T. Yamamoto, T. Kanai, K. Funakubo, M. Suemitsu, J. Itatani, F. Komori, S. Shin, and I. Matsuda, Appl. Phys. Lett. 104, 161103 (2014).